What’s the proportion of people who believe in god?
Author
Diya Bijoy
Published
November 4, 2025
R Packages Setup
library(ggformula)
Loading required package: ggplot2
Loading required package: scales
Loading required package: ggridges
New to ggformula?  Try the tutorials:
    learnr::run_tutorial("introduction", package = "ggformula")
    learnr::run_tutorial("refining", package = "ggformula")
library(janitor)
Attaching package: 'janitor'
The following objects are masked from 'package:stats':

    chisq.test, fisher.test
library(mosaic)
Registered S3 method overwritten by 'mosaic':
  method                           from
  fortify.SpatialPolygonsDataFrame ggplot2
The 'mosaic' package masks several functions from core packages in order to add
additional features.  The original behavior of these functions should not be affected by this.
Attaching package: 'mosaic'
The following objects are masked from 'package:dplyr':

    count, do, tally
The following object is masked from 'package:Matrix':

    mean
The following object is masked from 'package:scales':

    rescale
The following object is masked from 'package:ggplot2':

    stat
The following objects are masked from 'package:stats':

    binom.test, cor, cor.test, cov, fivenum, IQR, median, prop.test,
    quantile, sd, t.test, var
The following objects are masked from 'package:base':

    max, mean, min, prod, range, sample, sum
library(naniar)library(skimr)
Attaching package: 'skimr'
The following object is masked from 'package:naniar':

    n_complete
The following object is masked from 'package:mosaic':

    n_missing
Attaching package: 'infer'

The following objects are masked from 'package:mosaic':

    prop_test, t_test
library(resampledata)
Attaching package: 'resampledata'

The following object is masked from 'package:datasets':

    Titanic
library(openintro)
Loading required package: airports
Loading required package: cherryblossom
Loading required package: usdata

Attaching package: 'openintro'

The following object is masked from 'package:GGally':

    tips

The following object is masked from 'package:mosaic':

    dotPlot

The following objects are masked from 'package:lattice':

    ethanol, lsegments
library(vcd)
Loading required package: grid

Attaching package: 'vcd'

The following object is masked from 'package:mosaic':

    mplot
                                   Name Gender Believe_in_God
1                               Sanjana Female            Yes
2                             Tathasthu   Male            Yes
3                               Vaibhav   Male            Yes
4                             Siddharth   Male            Yes
5                                 Ashik   Male             No
6                               Kshirab Female            Yes
7                               Niyosha Female            Yes
8                                Charvi Female             No
9                                 Anoti Female            Yes
10                                Dhruv   Male             No
11                               Maanya Female             No
12                               Aaksha Female            Yes
13                                Adhil   Male             No
14                              Aradhya   Male            Yes
15                             Prathana Female            Yes
16                              Ashmita Female            Yes
17                               Ishita Female             No
18                                Rishi   Male             No
19 Arnav Kodhandapani  Anupama Srikanth   Male             No
20                               Nitish   Male            Yes
21                             Avanilka Female            Yes
22                             Lakshita Female            Yes
23                              Nandana Female            Yes
24                              Mridula Female            Yes
25                                Shiva   Male             No
26                                 Diya Female            Yes
27                              Kanishk   Male             No
28                              Samaraj   Male            Yes
29                                Nipun   Male            Yes
30                            Vasudhara Female             No
31                               Aditya   Male             No
32                                Risha Female            Yes
33                              Jashith   Male             No
34                               Swetha Female            Yes
35                                Rishi   Male            Yes
36                                Manal Female            Yes
37                              Shruthi Female            Yes
38                               Aditya   Male             No
39                              Ashmita Female             No
40                             Krithika Female            Yes
41                                 Diya Female            Yes
# A tibble: 4 × 3
# Groups:   Gender [2]
  Gender Believe_in_God     n
  <fct>  <fct>          <int>
1 Female No                 5
2 Female Yes               18
3 Male   No                10
4 Male   Yes                8
Visualising Data
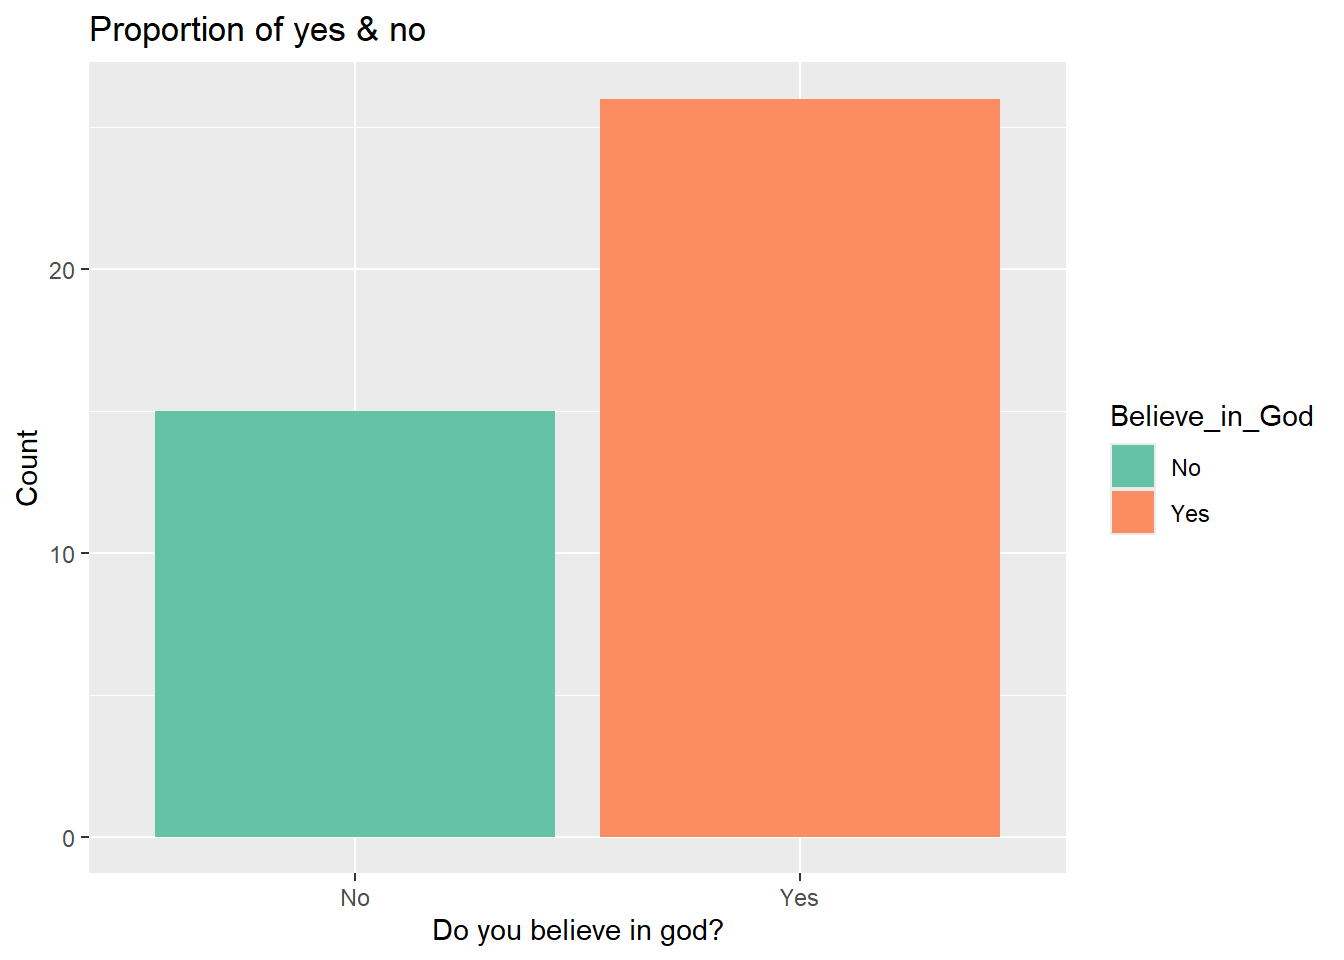
belief_modified2 %>%gf_bar(~Believe_in_God, fill =~ Believe_in_God) %>%gf_labs(x ="Do you believe in god?",y ="Count",title ="Proportion of yes & no" ) %>%gf_refine(scale_fill_brewer(palette ="Set2"))
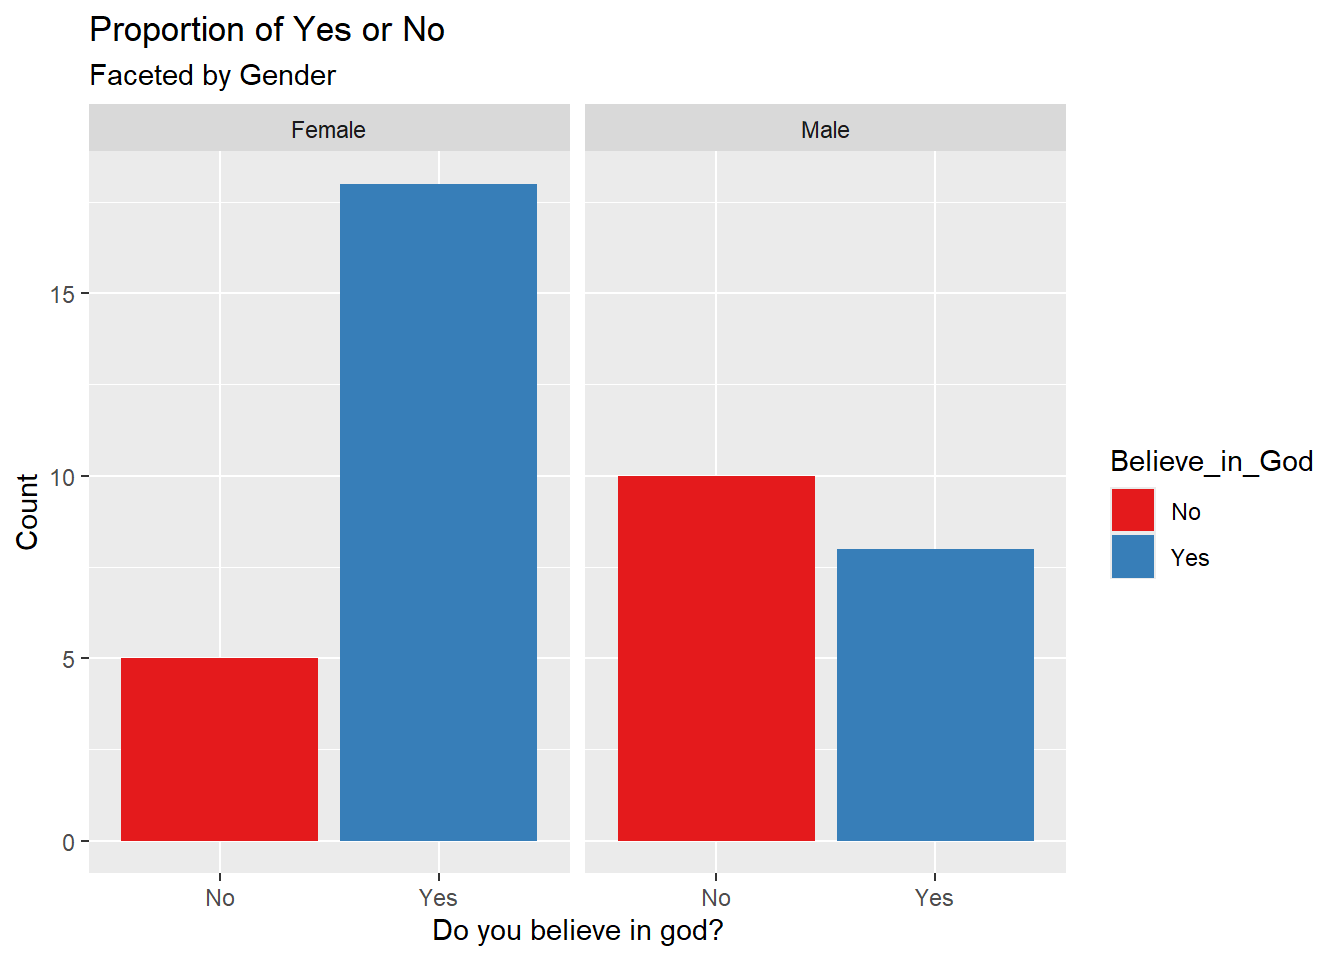
belief_modified2 %>%gf_bar(~Believe_in_God | Gender, fill =~ Believe_in_God) %>%gf_labs(x ="Do you believe in god?",y ="Count",title ="Proportion of Yes or No",subtitle ="Faceted by Gender" ) %>%gf_refine(scale_fill_brewer(palette ="Set1"))
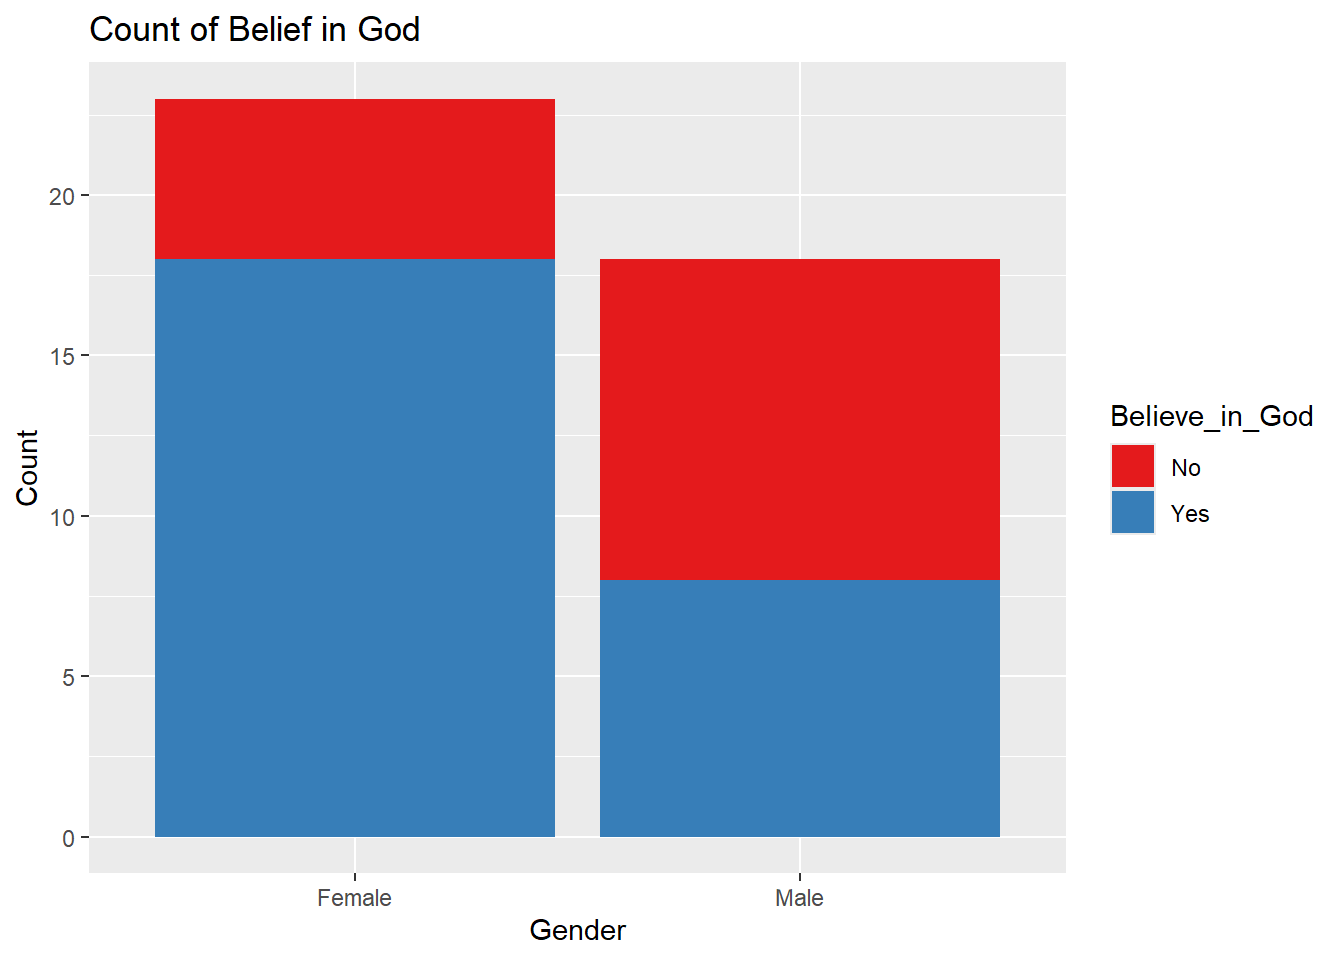
belief_modified2 %>%gf_bar(~Gender, fill =~ Believe_in_God, position ="stack") %>%gf_labs(x ="Gender",y ="Count",title ="Count of Belief in God" ) %>%gf_refine(scale_fill_brewer(palette ="Set1"))
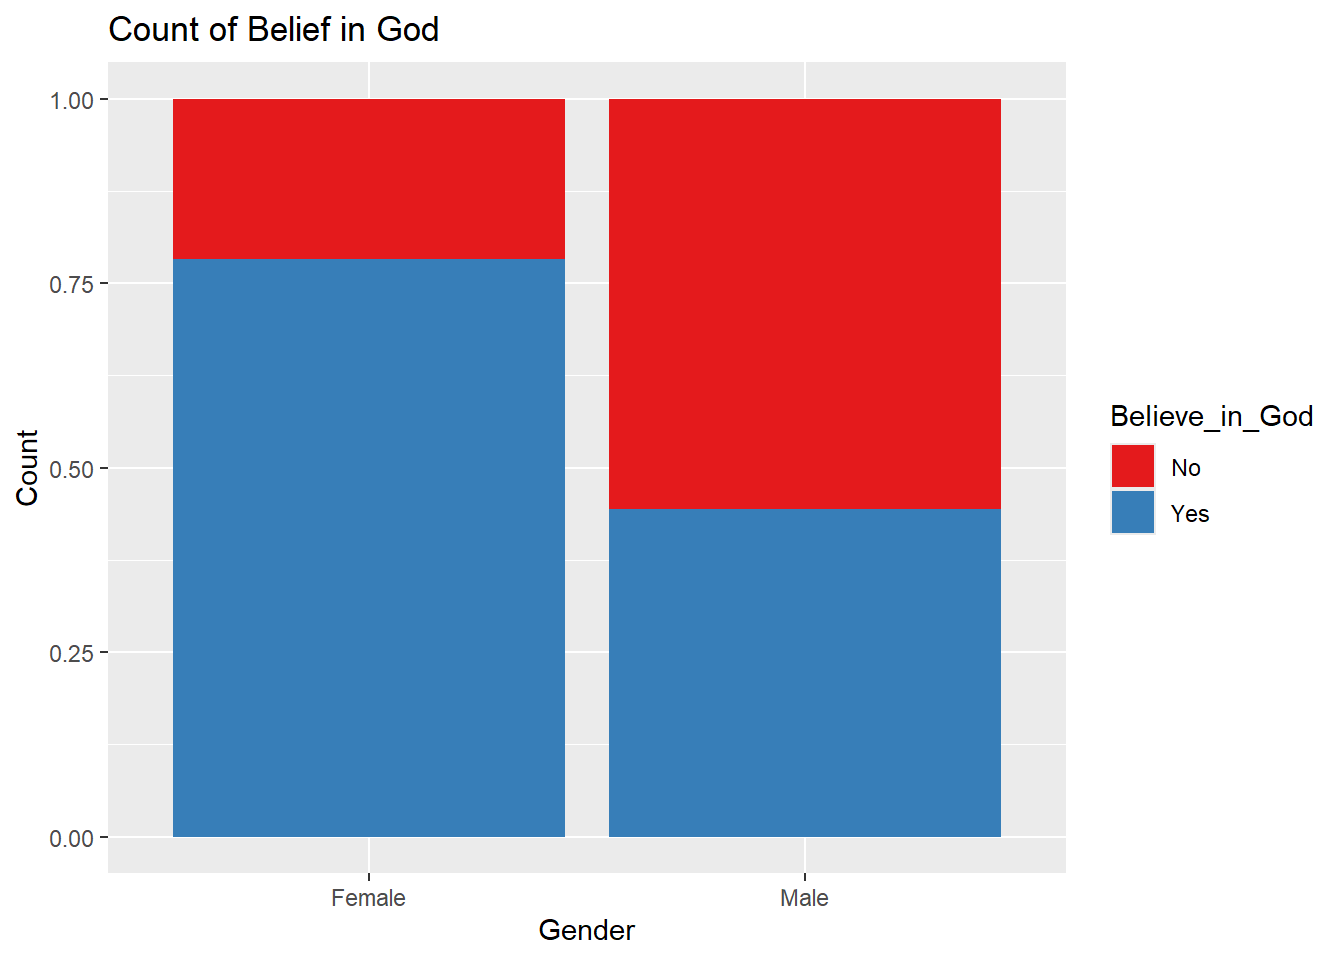
belief_modified2 %>%gf_bar(~Gender, fill =~ Believe_in_God, position ="fill") %>%gf_labs(x ="Gender",y ="Count",title ="Count of Belief in God" ) %>%gf_refine(scale_fill_brewer(palette ="Set1"))
Prop Test: Do a majority of the people believe in god?
H0: Half of the people believe in God (p = 0.5)
H1: The proportion of people who believe in God is not equal to 0.5.
mosaic::binom.test(~Believe_in_God, data = belief_modified2, success ="Yes") %>% broom::tidy()
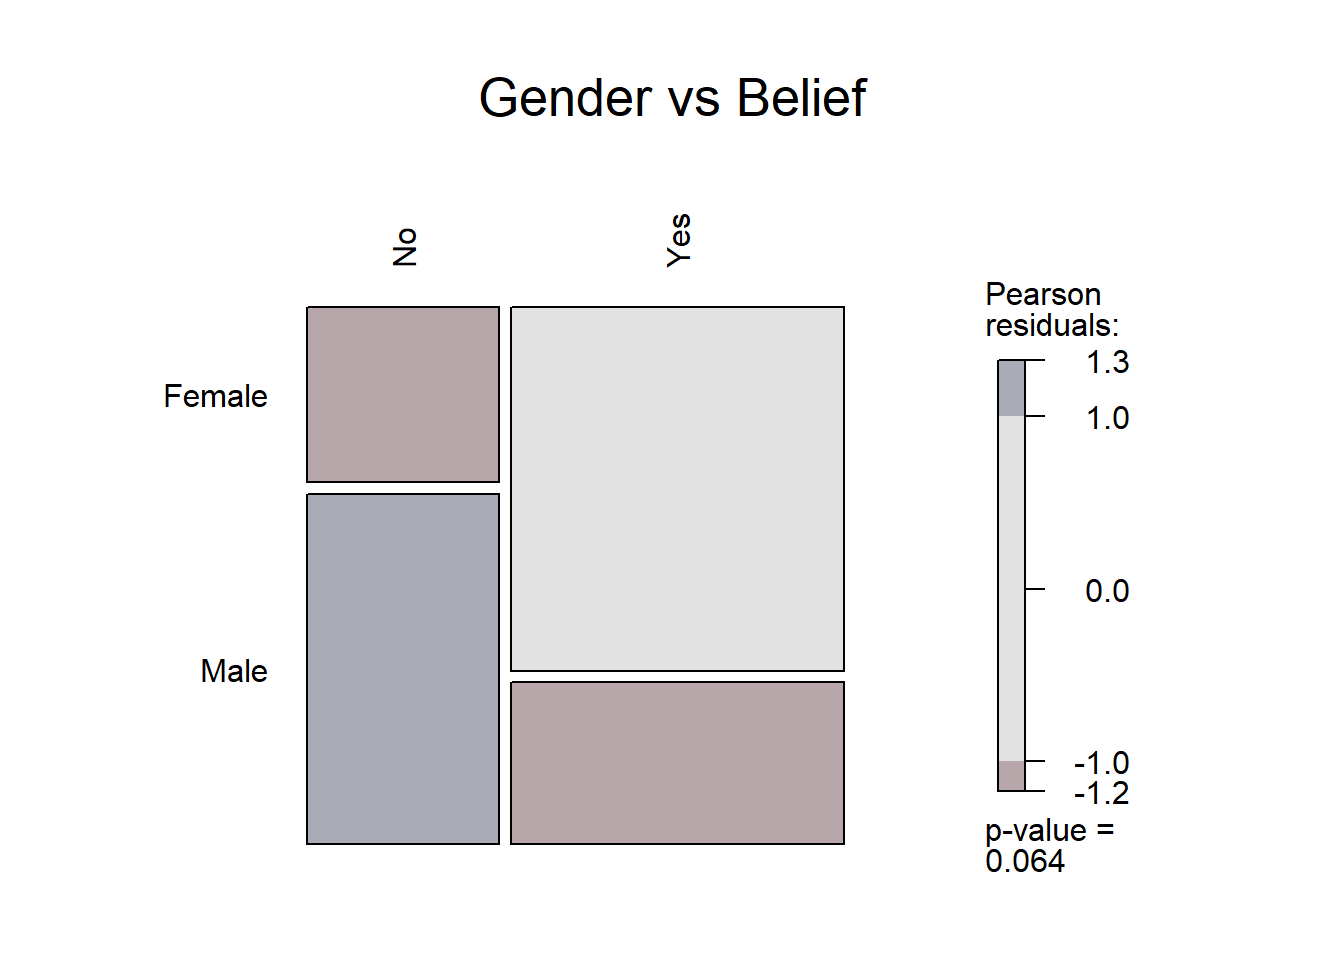
The p value = 0.056, so we fail to reject the Null Hypothesis.
This means belief in God does not differ between males and females — both genders showed similar levels of belief.
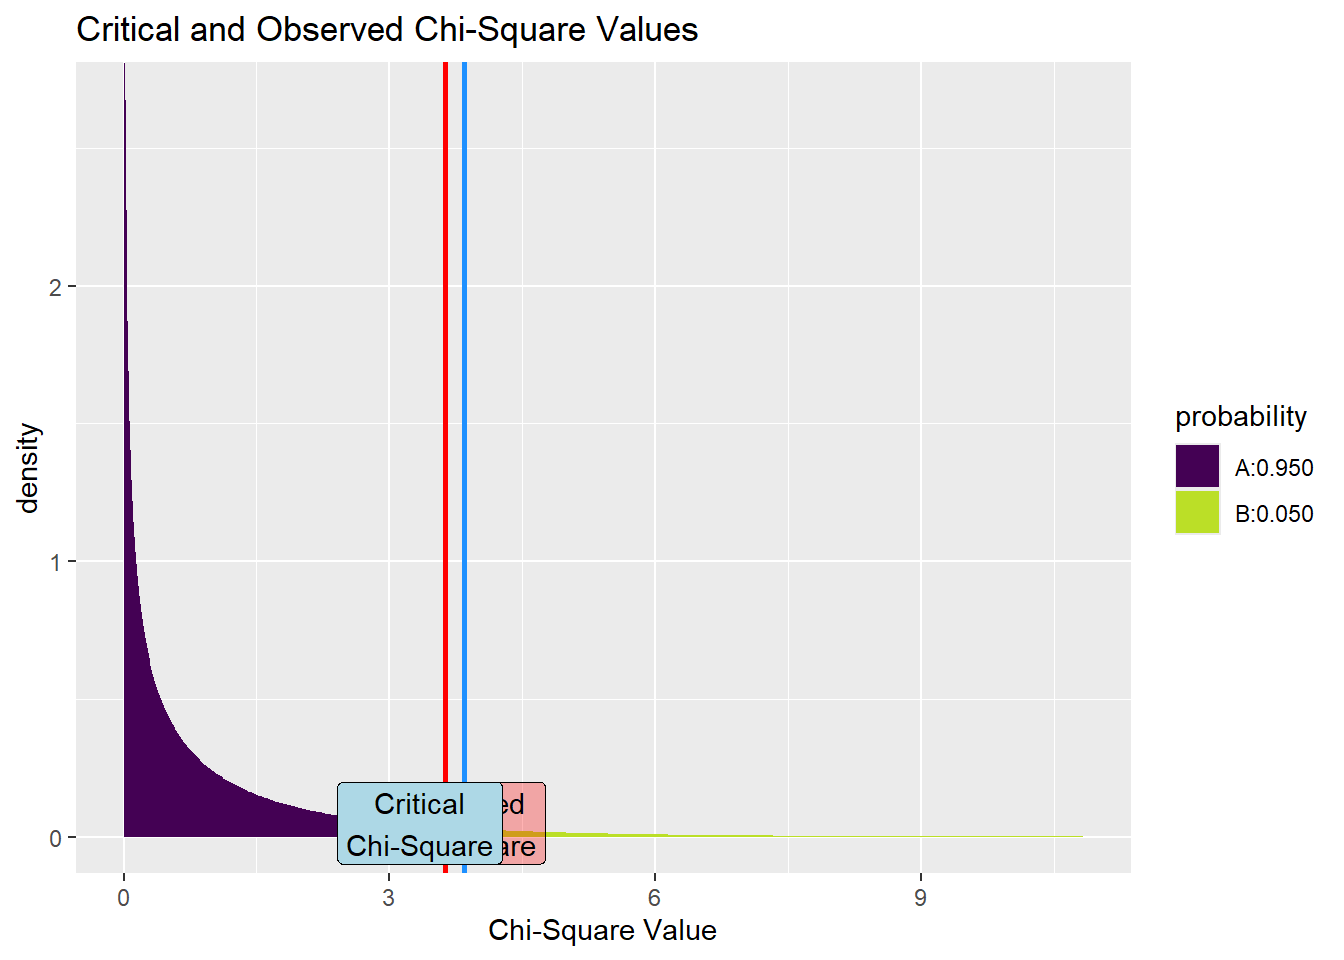
Conclusion:
To sum up, there is an equal proportion of people who believe in god. A chi-square test was conducted to see if opinions differ from men to women. The test showed no significant difference as both males and females. Overall, we see that belief in god between males and females does not differ significantly, both genders show similar levels of belief.